Usage
The main component in the pikos toolset is the Monitor. A monitor creates a number of records during the execution of the code which are passed on the recorder to be stored into memory or file.
In code
Monitors can be used programmatically in a number of ways.
Enabled/Disabled using the corresponding functions:
from pikos.api import screen
from pikos.monitors.api import FunctionMonitor

monitor = Monitor(recorder=screen())
monitor.enable()

# monitored code
#

monitor.disable()
A monitor instance can be used as a context manager:
from pikos.api import screen
from pikos.monitors.api import FunctionMonitor

monitor = Monitor(recorder=screen())

with monitor:
    # monitored code
    #
    pass
With the use of the attach method a monitor becomes a decorator:
from pikos.api import screen
from pikos.monitors.api import FunctionMonitor

monitor = Monitor(recorder=screen())

@monitor.attach
def monitored_function():
    # monitored code
    #
    pass
Finally the pikos.api module provides easy to use decorator factories for the standard monitors. The factories can optionally accept a recorder and dictate if a focused monitor should be used:
from pikos.api import function_monitor, csv_file

@function_monitor(recorder=csv_file(), focused=True)
def monitored_function():
    # monitored code
    #
    pass
Command line
The standard pikos monitors can be also used throught a command prompt tool, pikos-run:
usage: pikos-run [-h] [-o OUTPUT] [--buffered] [--recording {screen,text,csv}]
                 [--focused-on FOCUSED_ON]
                 {functions,line_memory,lines,function_memory} script

Execute the python script inside the pikos monitor context.

positional arguments:
  {functions,line_memory,lines,function_memory}
                        The monitor to use
  script                The script to run.

optional arguments:
  -h, --help            show this help message and exit
  -o OUTPUT, --output OUTPUT
                        Output results to a file
  --buffered            Use a buffered stream.
  --recording {screen,text,csv}
                        Select the type of recording to use.
  --focused-on FOCUSED_ON
                        Provide the module path(s) of the method where
                        recording will be focused. Comma separated list of
                        importable functions
Example
Given the code bellow:
""" Mandelbrot Set example

Code from the Tentative Numpy Tutorial

url: http://wiki.scipy.org/Tentative_NumPy_Tutorial/Mandelbrot_Set_Example

"""

from numpy import *
import pylab


def mandelbrot(h, w, maxit=20):
    '''Returns an image of the Mandelbrot fractal of size (h,w).
    '''
    y,x = ogrid[-1.4:1.4:h*1j, -2:0.8:w*1j]
    c = x+y*1j
    z = c
    divtime = maxit + zeros(z.shape, dtype=int)

    for i in xrange(maxit):
       z = z**2 + c
       diverge = z*conj(z) > 2**2            # who is diverging
       div_now = diverge & (divtime==maxit)  # who is diverging now
       divtime[div_now] = i                  # note when
       z[diverge] = 2                        # avoid diverging too much

    return divtime


if __name__ == '__main__':
    pylab.imshow(mandelbrot(400,400))
    pylab.show()
Running:
pikos-run line_memory examples/mandelbrot_set_example.py --recording csv --focused-on=mandelbrot
from the root directory will run the mandelbrot example and record the memory usage on function entry and exit while inside the mandelbrot method. The monitoring information will be recorded in csv format in the monitor_records.csv (default filename).
CSV Sample
index,function,lineNo,RSS,VMS,line,filename
0,mandelbrot,16,64679936,382787584,"    y,x = ogrid[-1.4:1.4:h*1j, -2:0.8:w*1j]",examples/mandelbrot_set_example.py
1,mandelbrot,17,64962560,383229952,    c = x+y*1j,examples/mandelbrot_set_example.py
2,mandelbrot,18,67678208,386056192,    z = c,examples/mandelbrot_set_example.py
3,mandelbrot,19,67817472,386056192,"    divtime = maxit + zeros(z.shape, dtype=int)",examples/mandelbrot_set_example.py
4,mandelbrot,21,69103616,387338240,    for i in xrange(maxit):,examples/mandelbrot_set_example.py
5,mandelbrot,22,69103616,387338240,       z = z**2 + c,examples/mandelbrot_set_example.py
6,mandelbrot,23,71671808,389902336,       diverge = z*conj(z) > 2**2            # who is diverging,examples/mandelbrot_set_example.py
7,mandelbrot,24,76263424,394760192,       div_now = diverge & (divtime==maxit)  # who is diverging now,examples/mandelbrot_set_example.py
8,mandelbrot,25,76529664,394760192,       divtime[div_now] = i                  # note when,examples/mandelbrot_set_example.py
9,mandelbrot,26,76529664,394760192,       z[diverge] = 2                        # avoid diverging too much,examples/mandelbrot_set_example.py
10,mandelbrot,21,76537856,394760192,    for i in xrange(maxit):,examples/mandelbrot_set_example.py
11,mandelbrot,22,76537856,394760192,       z = z**2 + c,examples/mandelbrot_set_example.py
12,mandelbrot,23,74452992,392675328,       diverge = z*conj(z) > 2**2            # who is diverging,examples/mandelbrot_set_example.py
13,mandelbrot,24,76881920,395235328,       div_now = diverge & (divtime==maxit)  # who is diverging now,examples/mandelbrot_set_example.py
14,mandelbrot,25,77012992,395235328,       divtime[div_now] = i                  # note when,examples/mandelbrot_set_example.py
15,mandelbrot,26,77012992,395235328,       z[diverge] = 2                        # avoid diverging too much,examples/mandelbrot_set_example.py
16,mandelbrot,21,77012992,395235328,    for i in xrange(maxit):,examples/mandelbrot_set_example.py
17,mandelbrot,22,77012992,395235328,       z = z**2 + c,examples/mandelbrot_set_example.py
18,mandelbrot,23,79441920,397795328,       diverge = z*conj(z) > 2**2            # who is diverging,examples/mandelbrot_set_example.py
19,mandelbrot,24,79572992,397795328,       div_now = diverge & (divtime==maxit)  # who is diverging now,examples/mandelbrot_set_example.py
The first column is the record index, followed by the function name and the line number where (just before execution) the RSS, VMS memory counters for the python process are recorded. The last two column contains the python line of the function.
Note
This record type is specific to the LineMemoryMonitor.
Plot Data
loading the csv file into ipython we can plot the graph of record index to RSS memory usage of the python process while executing the mandelbrot function:
In [1]: import numpy

In [2]: import pylab

In [3]: data = numpy.loadtxt('monitor_records.csv',usecols=[0, 3], delimiter=',', skiprows=1)

In [4]: pylab.plot(data[:, 0], data[:, 1], drawstyle='steps')

In [5]: pylab.show()
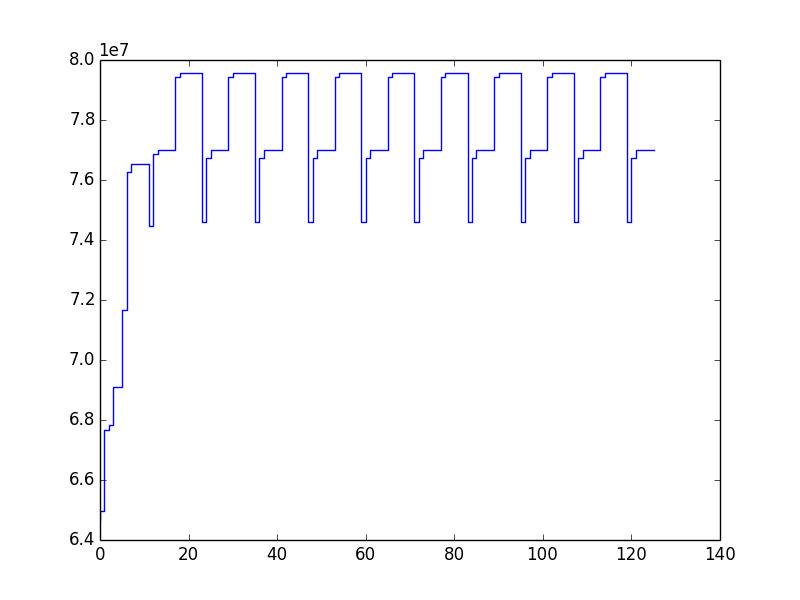
The plot of record index vs RSS memory usage (in bytes) of the python process when running the mandelbrot function.